
System monitoring is defined as the continuous, automated process of tracking hardware performance, software behavior, and network activity to detect failures before they disrupt operations. Done right, it is your first line of defense against both downtime and security breaches. This guide walks you through system monitoring step by step, from identifying which metrics matter to configuring alerts that actually fire when something goes wrong. You will work with tools like Prometheus, Grafana, and Node Exporter, and you will leave with a process you can repeat, document, and hand off to your team.
What system components and metrics you must monitor
Effective monitoring focuses on five core pillars: CPU usage, memory utilization, disk health, network throughput, and process management. Each pillar tells a different story about your system's condition. Ignoring any one of them creates a blind spot that attackers or hardware failures can exploit.
Here is what to track within each category:
- CPU: Load averages over 1, 5, and 15 minutes. A load average consistently above your core count signals a bottleneck. Sustained high CPU can also indicate malware running in the background.
- Memory: Total used versus available RAM, plus swap usage. Heavy swap activity means your system is compensating for insufficient RAM, which slows everything down.
- Disk: I/O latency, read/write rates, and available space. Disk I/O rates are critical metrics because a spike in write activity can indicate ransomware encrypting files.
- Network: Bytes in and out per interface, packet loss, and error rates. Unusual outbound traffic is one of the clearest early signs of a compromised machine.
- Processes: Which services are running, their CPU and memory consumption, and whether critical processes have stopped unexpectedly.
A manufacturing company running CNC equipment, for example, cannot afford a file server to go unresponsive mid-shift. Monitoring disk I/O and process health on that server gives you a 15-minute warning instead of a phone call from the shop floor.
Pro Tip: Prioritize metrics tied to your most business-critical systems first. A five-server environment does not need uniform monitoring depth across every machine. Weight your alerting toward the systems that stop revenue if they fail.

What tools and prerequisites do you need first?
The most widely used open-source monitoring stack combines Prometheus, Grafana, and Node Exporter. Prometheus scrapes metrics every 15 seconds by default, Node Exporter exposes Linux system metrics, and Grafana renders them into readable dashboards. This stack is free, well-documented, and scales from a single server to hundreds.
For environments where you cannot install software on every host, agentless monitoring using SNMP (Simple Network Management Protocol), WMI (Windows Management Instrumentation), or SSH is a practical alternative. Agentless approaches work well for stable or legacy environments, such as older Windows servers in professional services firms or network switches in a manufacturing plant.
Before you install anything, confirm you have the following in place:
| Prerequisite | Details | Why It Matters |
|---|---|---|
| Server or VM access | Root or admin rights on the target host | Required for agent installation |
| Open firewall ports | Port 9090 (Prometheus), 3000 (Grafana), 9100 (Node Exporter) | Enables metric scraping and dashboard access |
| Linux or Windows OS | Ubuntu 20.04+ or Windows Server 2019+ recommended | Determines which agents and exporters apply |
| Docker (optional) | Docker Engine and Docker Compose installed | Simplifies setup and teardown for learning |
| Network visibility | Monitoring server can reach all target hosts | Agentless monitoring requires direct network access |
Pro Tip: Containerized setups using Docker let you break and rebuild your monitoring stack in under an hour without touching production systems. Start there before deploying to live infrastructure.
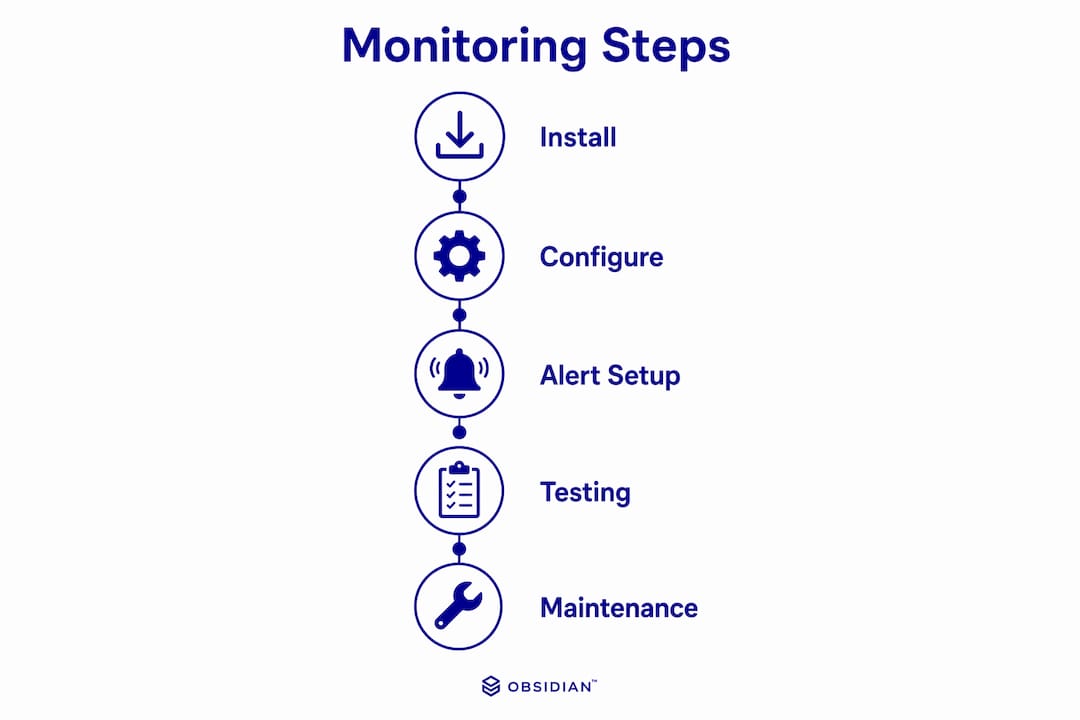
How to implement system monitoring step by step
This is the execution phase. The industry term for what you are building is an observability stack, which combines metrics, logs, and alerts into a unified view. Follow these steps in order.
-
Install Node Exporter on the target server. Download the Node Exporter binary from the Prometheus GitHub releases page, create a dedicated system user, and run it as a service. It will expose metrics at
http://your-server-ip:9100/metrics. -
Install Prometheus on your monitoring server. Download the Prometheus binary, configure
prometheus.ymlto point to your Node Exporter endpoint, and start the service. Prometheus scrapes metrics on a 15–30 second interval, giving you near-real-time visibility. -
Configure Prometheus scraping. In
prometheus.yml, add a scrape job targeting your Node Exporter host and port. Verify the target appears as "UP" in the Prometheus web UI at port 9090. -
Install Grafana. Add the Grafana APT or YUM repository, install the package, and start the service. Access the web UI at port 3000 using the default admin credentials, then change the password immediately.
-
Add Prometheus as a data source in Grafana. Navigate to Configuration > Data Sources, select Prometheus, and enter your Prometheus server URL. Click "Save & Test" to confirm the connection.
-
Import a pre-built dashboard. Grafana's dashboard library includes Node Exporter Full (Dashboard ID 1860), which covers CPU, memory, disk, and network in one view. Import it by ID to skip manual panel creation.
-
Write alerting rules using PromQL. PromQL is Prometheus's query language, and it powers both dashboards and alerts. A basic disk alert looks like this:
(node_filesystem_avail_bytes / node_filesystem_size_bytes) * 100 < 10, which fires when less than 10% disk space remains. -
Configure Alertmanager. Install Alertmanager, link it to Prometheus, and define routing rules that send alerts to email, Slack, or PagerDuty. Alertmanager routes firing alerts to the right channels and suppresses duplicates during an ongoing incident.
| Step | Task | Estimated Time |
|---|---|---|
| 1 | Install Node Exporter | 10 minutes |
| 2–3 | Install and configure Prometheus | 15 minutes |
| 4–5 | Install Grafana and connect data source | 10 minutes |
| 6 | Import dashboard | 5 minutes |
| 7–8 | Configure alerts and Alertmanager | 20 minutes |
A small test setup is achievable in under 60 minutes. That timeline holds for a single-server environment with Docker Compose handling the orchestration.
Pro Tip: Tune alerts gradually rather than enabling everything at once. Start with high-confidence thresholds like disk usage above 90% or a critical service going down. Add behavioral alerts only after your team trusts the baseline ones.
How do you maintain monitoring for long-term reliability?
Building the stack is the easy part. Keeping it accurate and compliant over time requires a structured maintenance schedule. Modern system monitoring has shifted from reactive troubleshooting to continuous automated validation. That shift only holds if you maintain the system behind it.
A tiered schedule keeps the workload manageable:
- Daily: Automated health checks on all monitored hosts. Verify that Node Exporter and Prometheus targets show "UP" status. Review any overnight alerts for patterns.
- Monthly: Review log files for anomalies that did not trigger alerts. Run Windows SFC (System File Checker) scans on Windows hosts, which take 15–30 minutes and catch file integrity issues before they escalate. Audit your alert rules for false positives.
- Quarterly: Full performance benchmarking against your baseline. Run S.M.A.R.T. (Self-Monitoring, Analysis, and Reporting Technology) diagnostics on all physical drives. Review hardware age and capacity trends. For manufacturing environments, this aligns well with a PLC maintenance schedule that covers both IT and operational technology.
Compliance adds another layer. ISO/IEC 27001:2022 requires monitoring logs to capture user context, kernel version, and timestamps. That level of detail is not just for auditors. It makes debugging faster and incident response more accurate.
Pro Tip: Document every change to your monitoring configuration in a version-controlled file or a simple change log. When a team member leaves or a new hire joins, that documentation is the difference between a smooth handoff and starting from scratch.
For manufacturers tracking aging control systems, an automation system audit checklist can complement your IT monitoring routine by covering the operational technology layer your Prometheus stack does not reach.
Key takeaways
Effective system monitoring requires the right metrics, the right tools, and a maintenance discipline that keeps the stack accurate and compliant over time.
| Point | Details |
|---|---|
| Monitor five core pillars | Track CPU, memory, disk, network, and processes to eliminate visibility blind spots. |
| Use Prometheus, Grafana, and Node Exporter | This open-source stack delivers real-time metrics, dashboards, and alerting in one setup. |
| Follow a tiered maintenance schedule | Daily checks, monthly log reviews, and quarterly audits keep monitoring reliable long-term. |
| Tune alerts before scaling them | Start with high-confidence thresholds to build trust before adding complex behavioral rules. |
| Log for compliance from day one | ISO/IEC 27001:2022 requires traceable, timestamped logs that also speed up incident response. |
Where most teams get system monitoring wrong
I have seen the same mistake repeated across dozens of small business environments: teams build a monitoring stack, set every possible alert to fire at the first sign of deviation, and then spend two weeks ignoring the noise until they turn the whole thing off. That is not a monitoring failure. That is an alert tuning failure.
Well-tuned alerting that filters noise is what separates a useful monitoring system from an expensive distraction. The goal is not to collect every metric available. The goal is to surface the three or four signals that tell you something is actually wrong before your users notice.
The other mistake I see is skipping the containerized learning phase entirely. Teams go straight to production, make a configuration error, and either break something or lose confidence in the tool. Containerized ephemeral environments exist precisely to prevent that. Spend a few hours breaking and rebuilding a Docker Compose stack before you touch a live server. You will learn more in that session than in any documentation.
For small businesses in regulated industries, the compliance angle is not optional. Logging with context is not bureaucratic overhead. It is the evidence trail that protects you during an audit or an incident investigation. Build it in from the start, not as an afterthought.
The teams that get monitoring right treat it as a living system. They review alerts monthly, adjust thresholds as their environment changes, and document every modification. That discipline is what makes monitoring a 24/7 operational asset rather than a one-time project.
— Michael
Let Symmnet handle your monitoring infrastructure
Setting up Prometheus and Grafana yourself is achievable. Keeping them accurate, compliant, and connected to a real incident response process is where most small businesses run short on time and expertise.
Symmnet delivers managed IT services that include 24/7 system monitoring, endpoint security, and compliance support built specifically for small U.S.-based businesses. Whether you are in manufacturing, aerospace, or professional services, Symmnet configures and maintains your monitoring stack, tunes your alerts, and responds when something fires. You get the visibility of an enterprise monitoring program without the overhead of building and staffing it yourself. Contact Symmnet for a free assessment to identify where your current monitoring has gaps.
FAQ
What is system monitoring in IT?
System monitoring is the process of continuously tracking hardware performance, software behavior, and network activity to detect and prevent failures. It covers metrics like CPU load, memory usage, disk health, and network throughput.
How long does it take to set up prometheus and grafana?
A basic Prometheus and Grafana setup with Node Exporter takes under 60 minutes for a single-server environment. Using Docker Compose reduces setup time and allows safe experimentation before production deployment.
What are the most important metrics to monitor first?
Start with disk usage, CPU load average, and critical service availability. These three metrics cover the most common causes of unplanned downtime and are the easiest to set reliable alert thresholds for.
What is the difference between agent-based and agentless monitoring?
Agent-based monitoring installs software on each host to collect metrics, while agentless monitoring uses protocols like SNMP or WMI to gather data remotely. Agentless suits stable or legacy environments where installing software on hosts is not practical.
How often should you review your monitoring alerts?
Review alert rules monthly to catch false positives and adjust thresholds as your environment changes. Quarterly reviews should include a full performance benchmark and hardware integrity check to keep your baseline accurate.